Research Plan Visualized

Using Research to Enhance Company-wide Workflows
Overview:
I led a research study for custom software and work practices across the Wizards of the Coast company. The old software supported all company products, but our primary focus was on the Magic: The Gathering card game. I documented the thoughts of 15 teams on the old and new software. I created 3 data visualization maps to help the client make successful choices. I curated a custom database with structured cross-linking between the data visualization maps. With these three areas, the client could feel confident executing workflow solutions. By utilizing a custom research plan and LLM usage, I was able to decrease task time by 40%.
Role
UX Researcher
Responsibility
Survey data, Data Collection, User Interviews, User Journey Maps, Project Brief Compilation, Data Visualization
For
Part of the $2.1 Billion initiative to enhance game portfolio focused on Magic: The Gathering.
Company
Wizards of the Coast
Challenge:
Our client hired our team to compile evidence for an updated toolchain process. Our client experienced pivotal challenges:
1) Most employees knew the old software didn't work, but few could say any of the specific issues
2) Previous efforts to replace software failed when employees refused to adopt it.
The company needed a deeper understanding of how its employees interact with the software to identify and prioritize employee pain points and improvement opportunities based on clear, data-driven insights.
Methods and Tools:
Alternative methods included team meetings, observation of internal communication, and quantifying conversations. Tools to use these methods included Miro, Microsoft Teams, and LLM software. The use of both helped fit my work within the company's schedule and budget. Below are sample statements and questions posed to employees using these tools.
-

13 Retrospectives from relevant teams
Sample Questions:
What do you like about your current system?
What is something that does not work in your current system?
If you had a magic wand, what is one thing you would change about your current process?
-

Internal community excitement thread
Sample Questions:
What are you most excited about?
What painful processes are you most looking forward to solving?
What do you want to see happen first?
-

24 LLM extracted Meetings
Sample Statements:
Read the provided transcript and provide a detailed summary.
You are a principal product manager in charge of creating user stories for replacing the current toolchain.
Using only this transcript, what are the detailed product requirements?
Research Process:
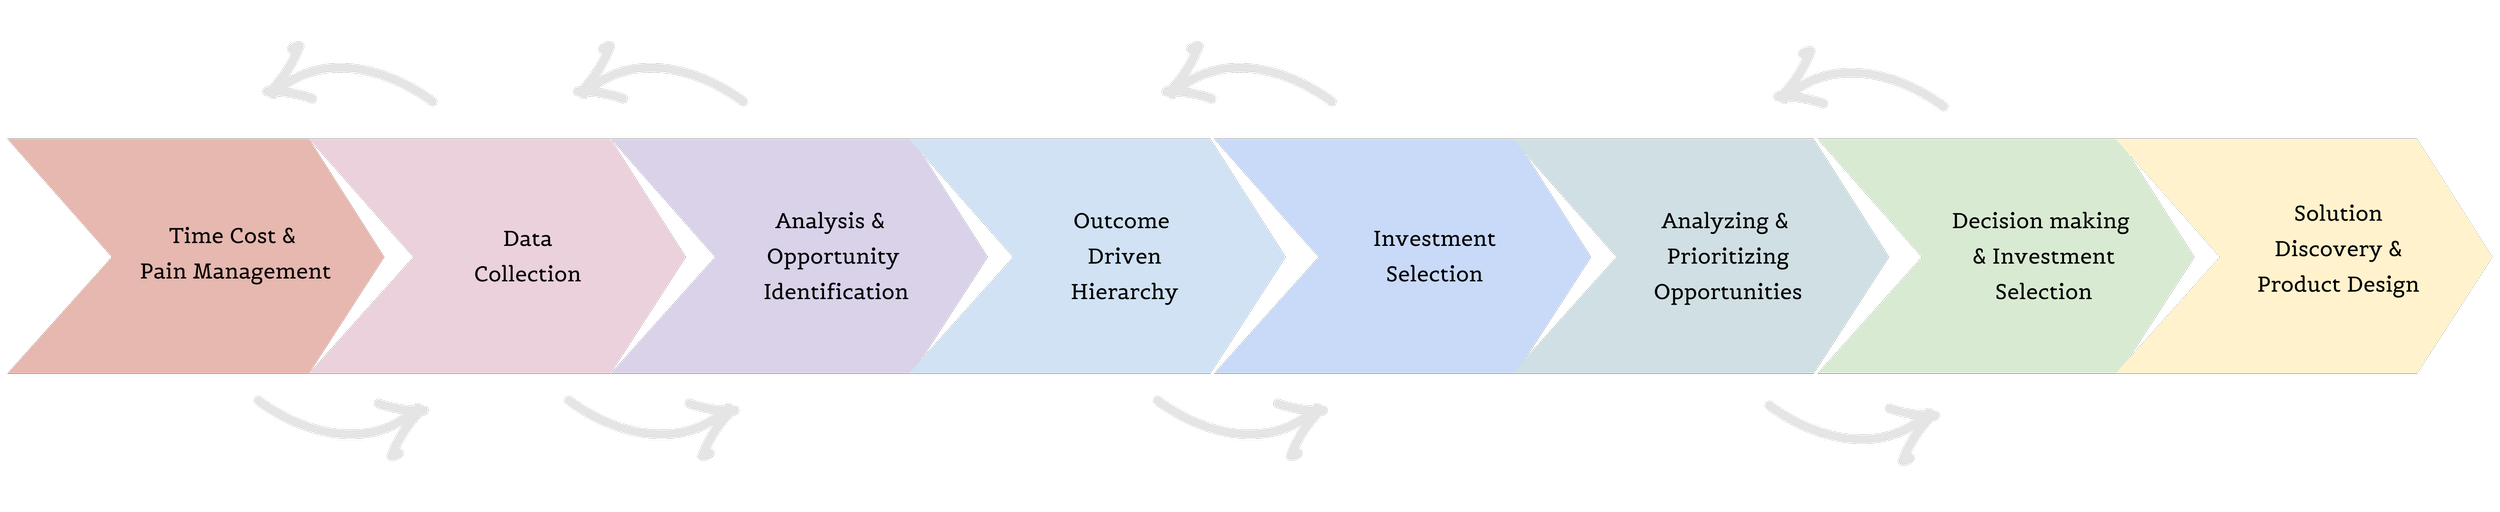
During the research process, it became clear that the project needed well-informed yet quick data collection for the client. The client lead, designers, and I collaborated to develop a Grounded Research evidence-based approach called ROOT to mitigate bias. It consisted of 8 segments completed during our 6-month engagement.
While following this process, certain stages had iterations or loop points. I show this by the cycling arrows for the ROOT diagram.
In the first stage, I created surveys while collecting measurements through team meetings.

“Measurement and Time Cost has enabled us to remain flexible and attuned to data while baselining and collecting evidence”
With baseline data established, I continued to collect data from interviews and surveys.
During this process, I realized the importance of employee morale in this project. I encouraged them by showing smaller chunks of data visualization and progress notes.
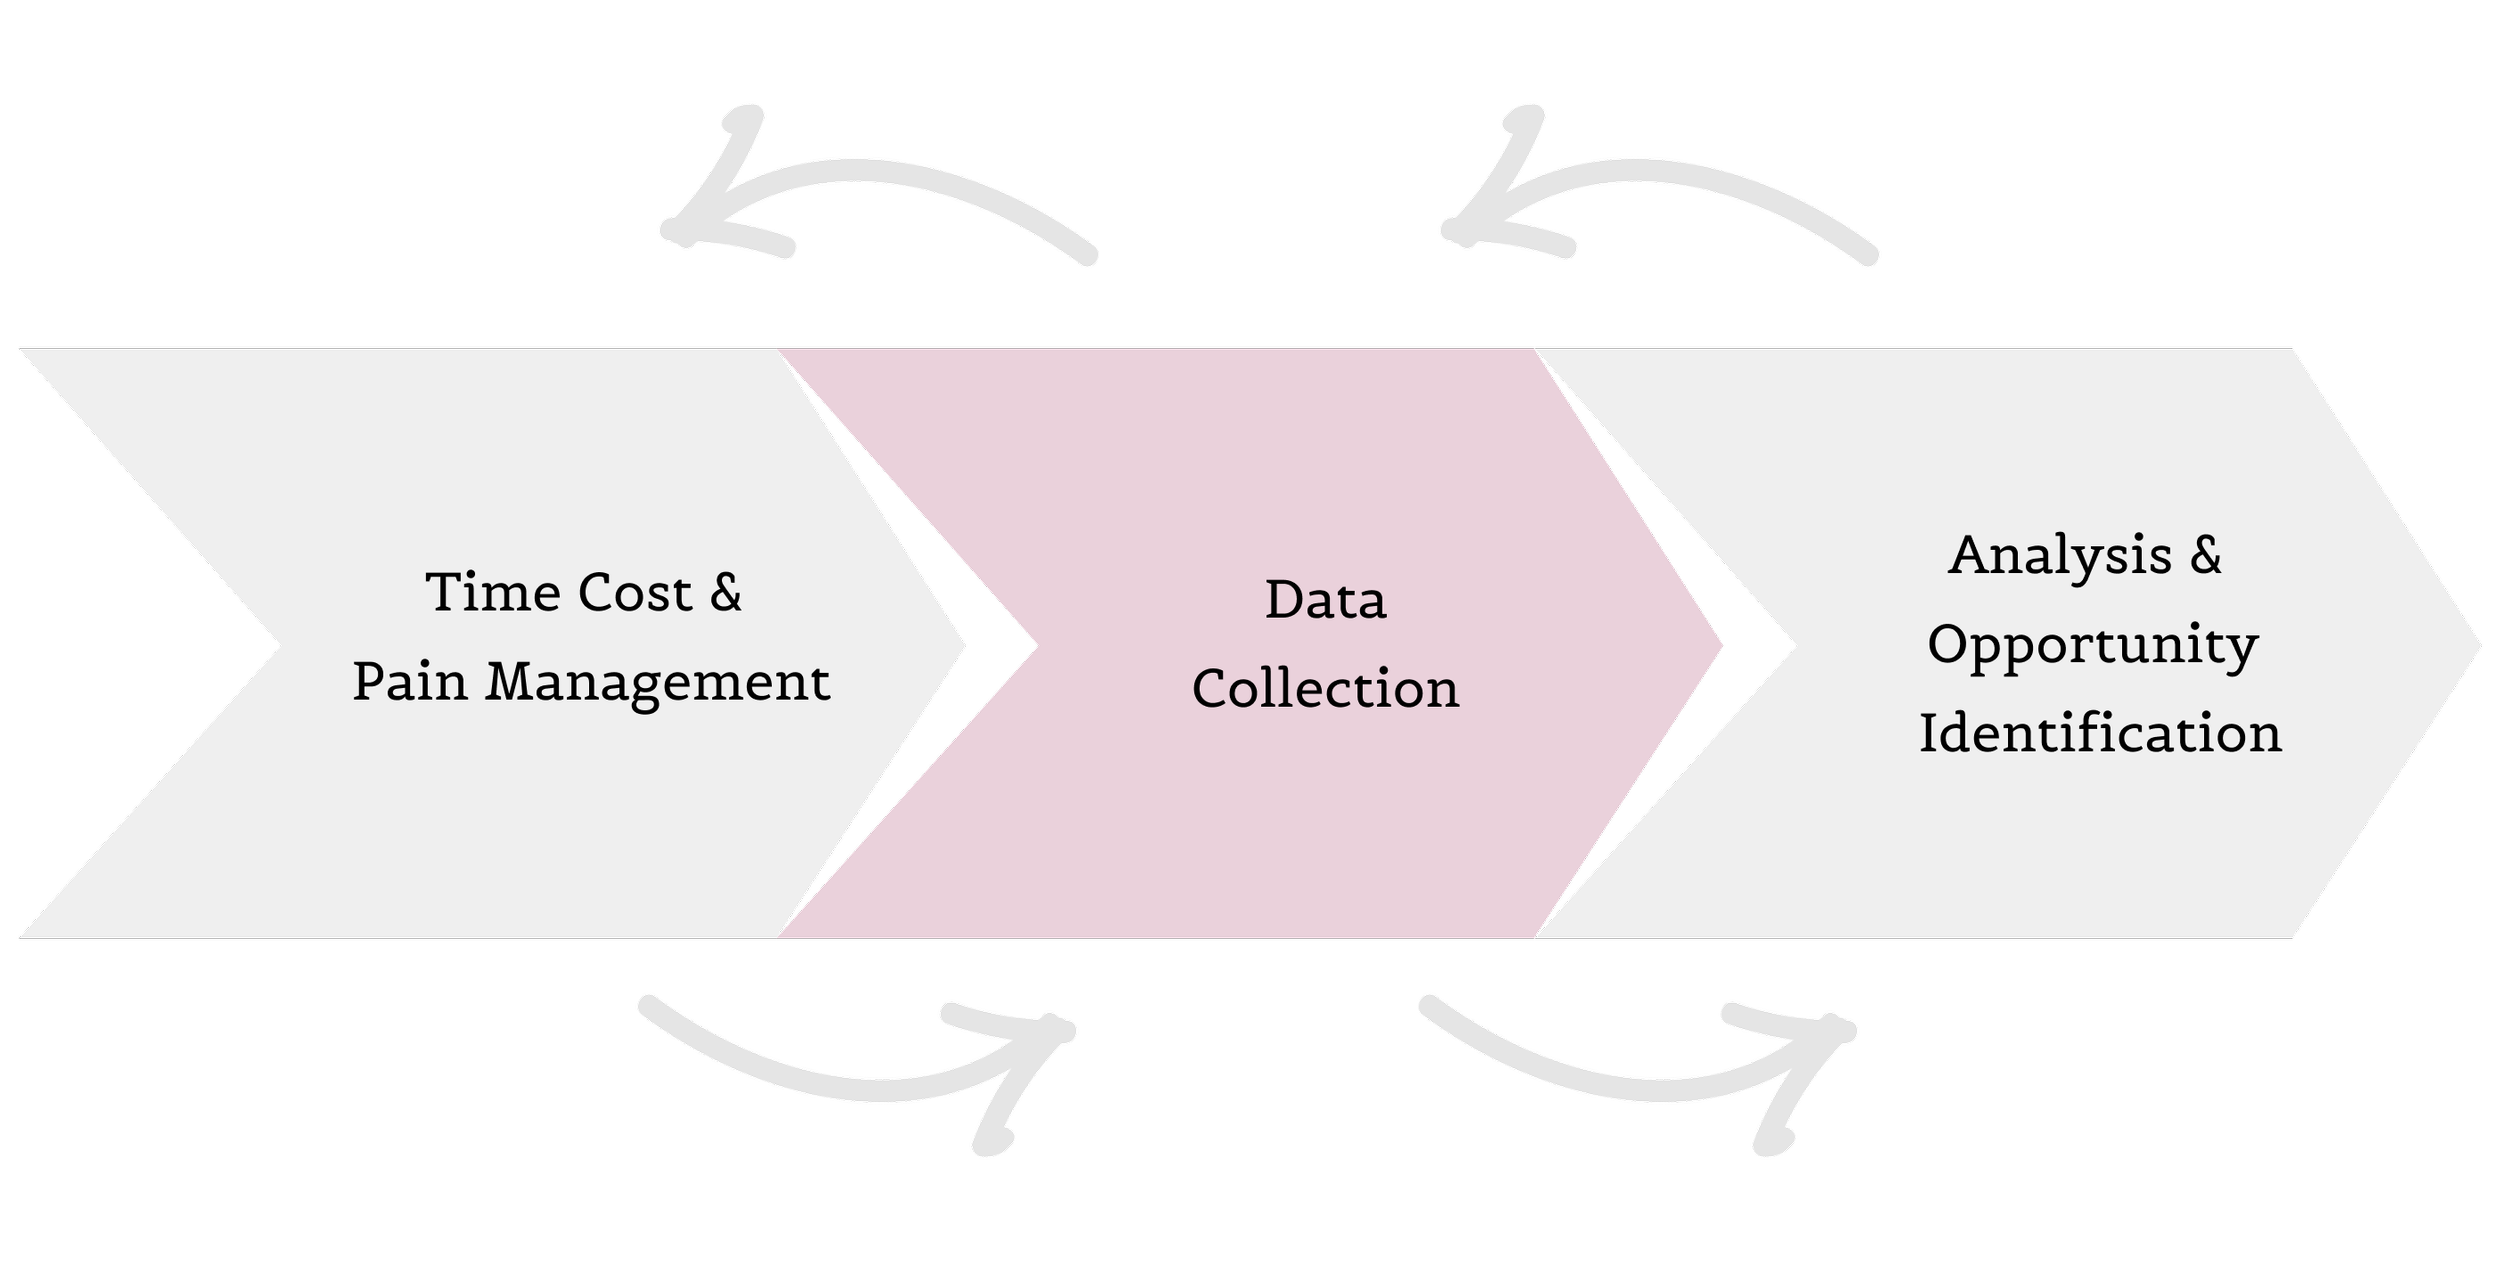
“From this data we built a robust dataset that reflects accurate theories of valuable opportunities.”
Internal Community Thread:
The interviews and internal conversations revealed agreement on both problems and excitement sources:
💻 Collaborative interfaces to allow for real-time actions and prevent miscommunication.
👥 Shared knowledge between different teams to prevent siloing of information and problematic troubleshooting.
⚙️ Automation of routine processes that allow for bulk actions in production.
🤝 Integration of information from other software used by the company
“Speed. I’m excited about speed. I’m not even sure how much I care about data accuracy at this point. I just don’t want to have enough time to make a sandwich. ”
Custom Database:
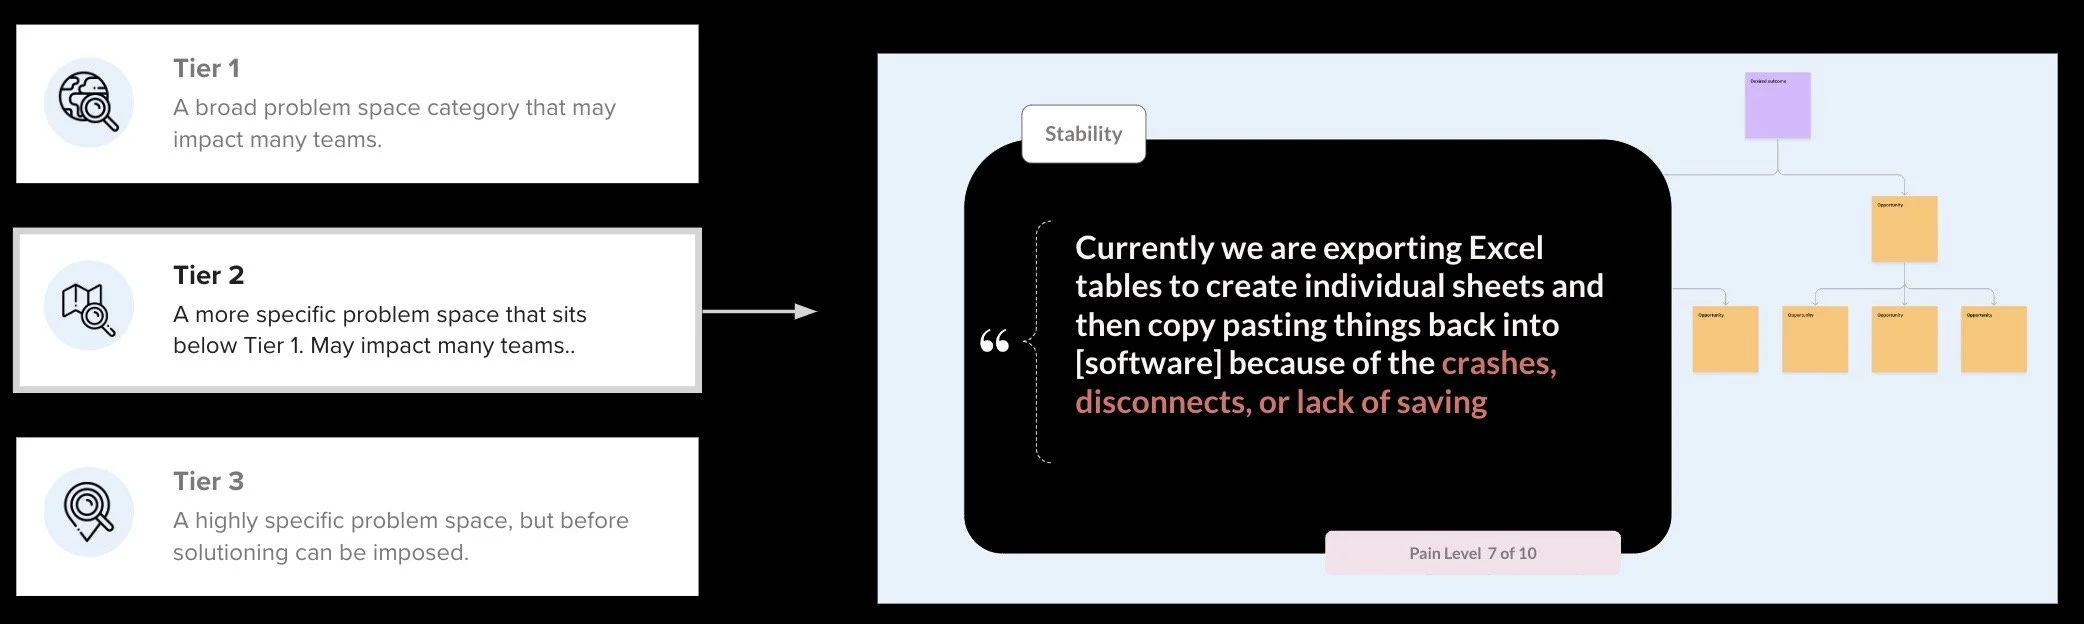
These areas needed further division to discuss targeted areas with the client.
While identifying opportunities, I worked with the team to create tiered connections. These categories are back-linked to the database.
Below is a quote from a subcategory with an attached pain level from the earlier survey data.

Resource Management:
II focused on resource management related to the custom database and user stories.
I saved resources by an estimated 40% through:
1) Maintaining the opportunity solution tree as we verified categories with the client
2) Using an LLM, recordings, and structured research questions to create user stories
The collected evidence was used to inform our client at this stage. I organized the data visualizations to showcase the best choices for our client.
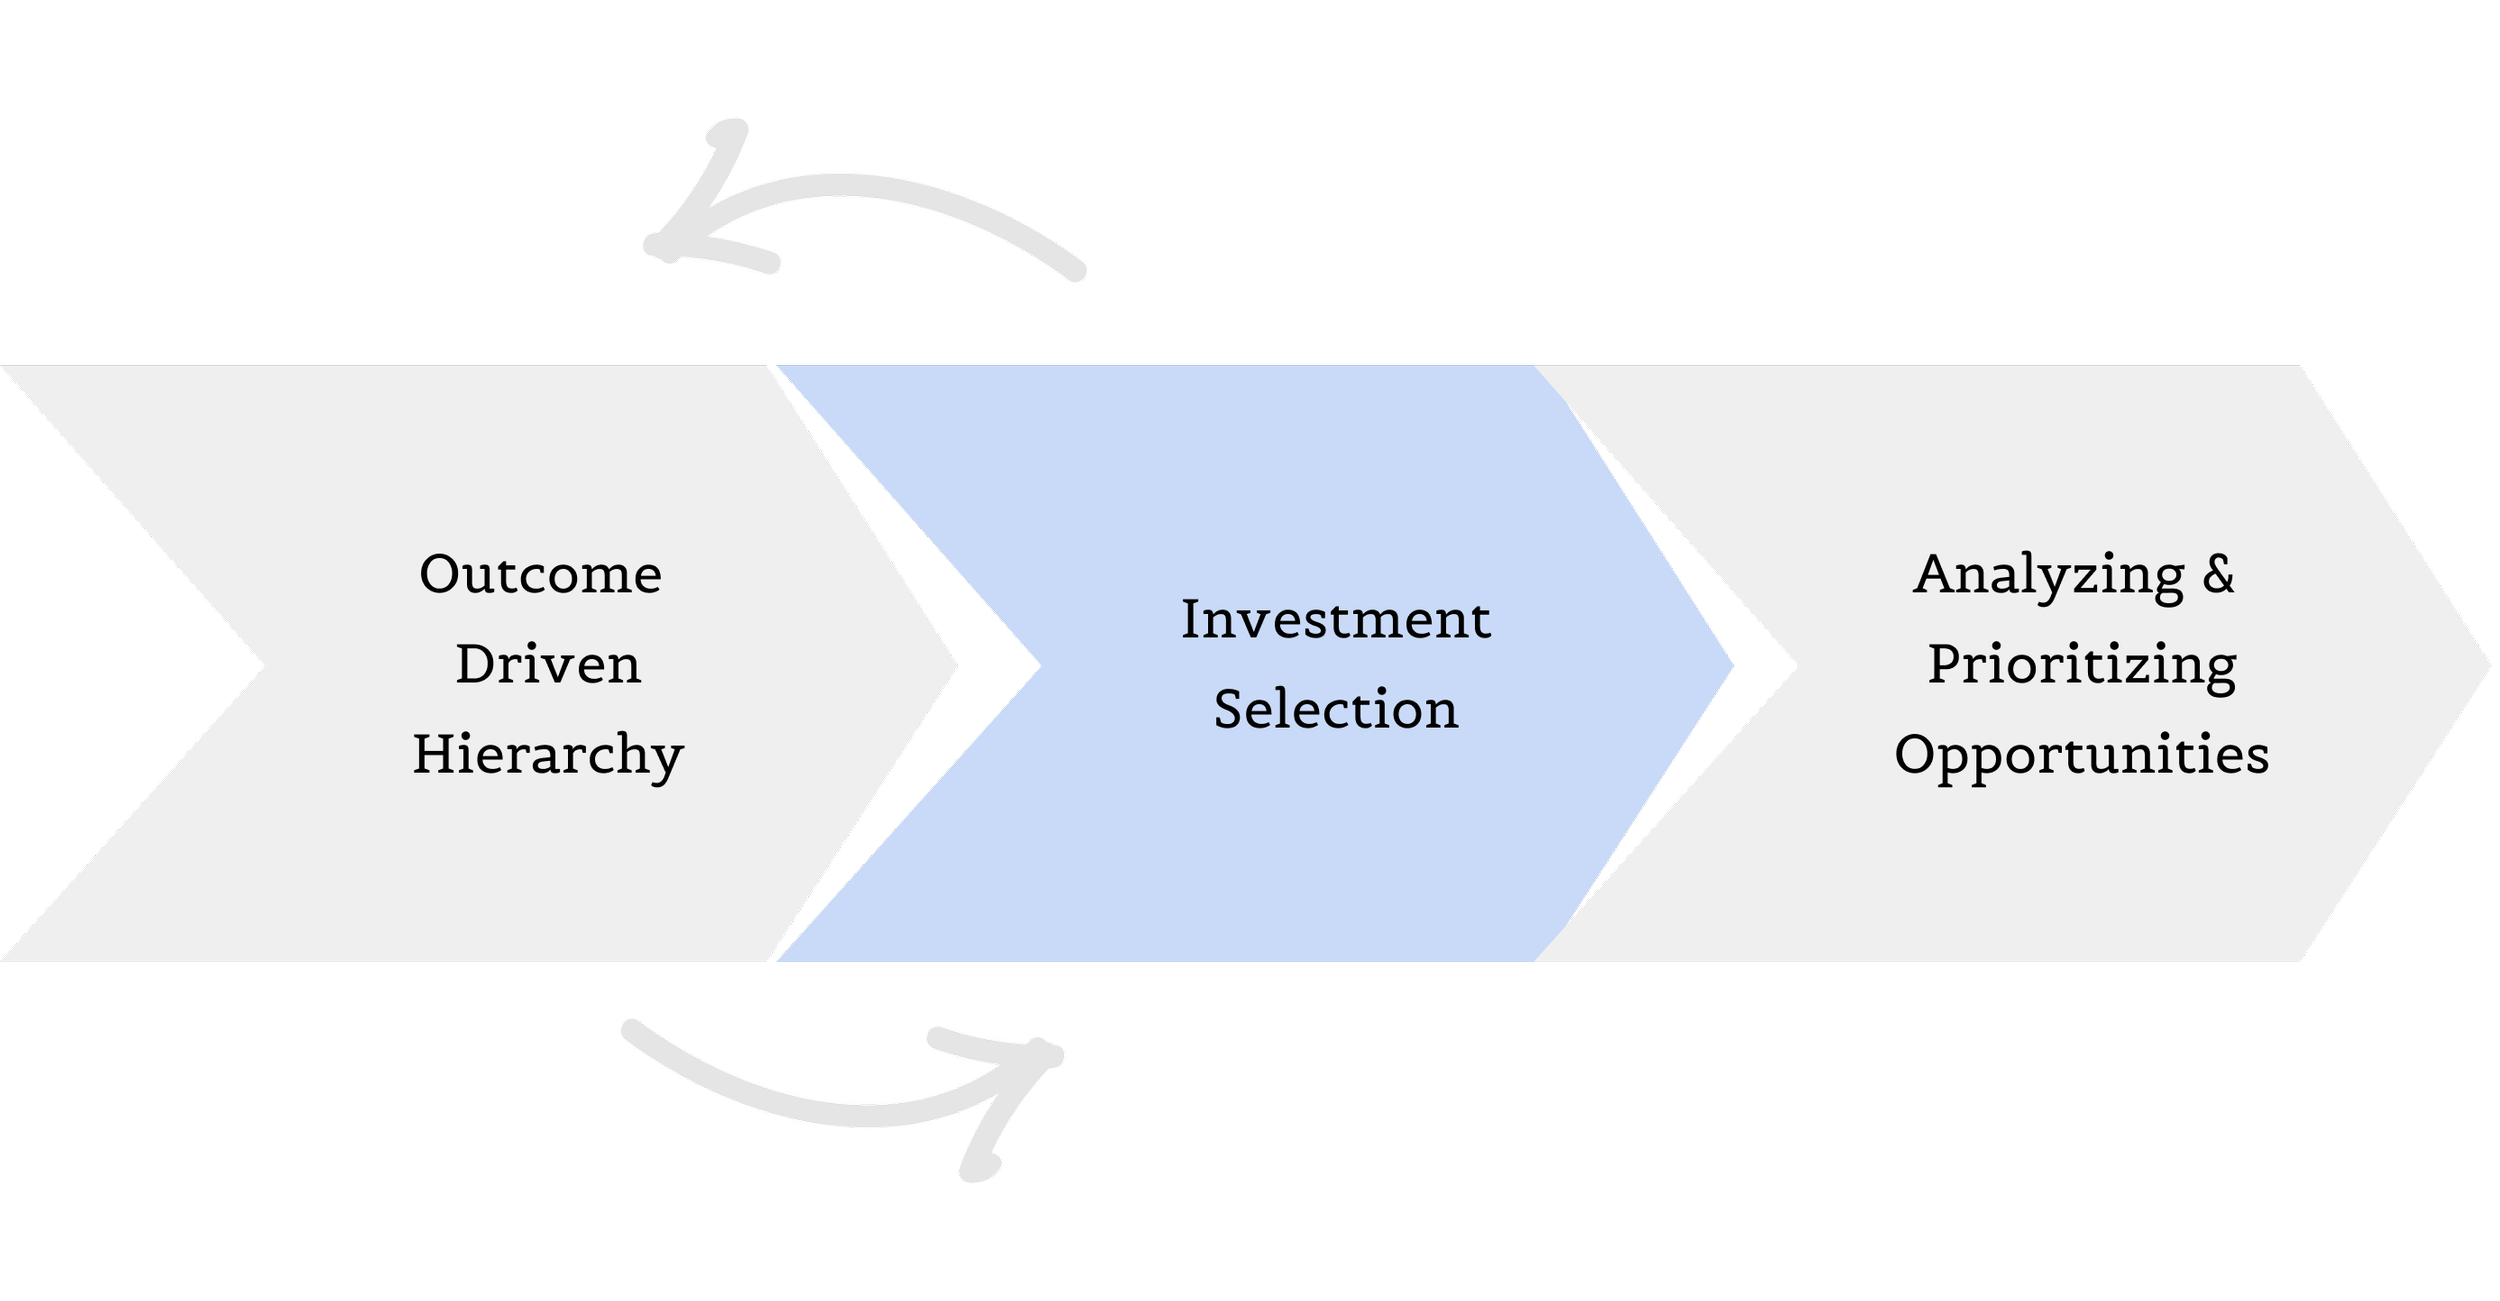
“This selection process provided multiple benefits, including the indication of areas where a single investment could yield multiple benefits”
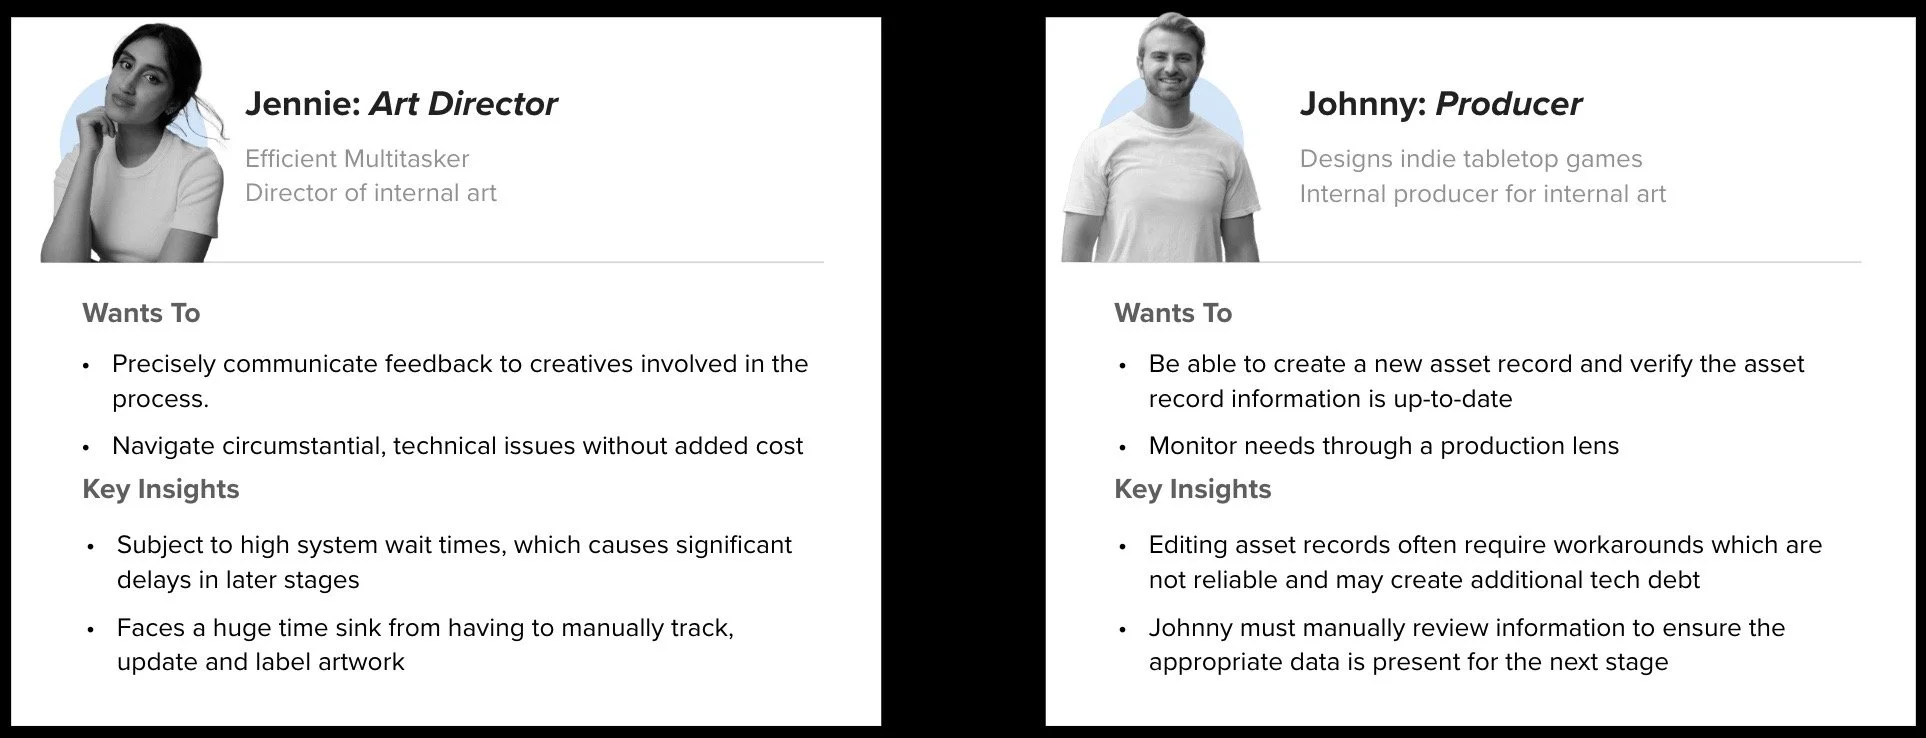
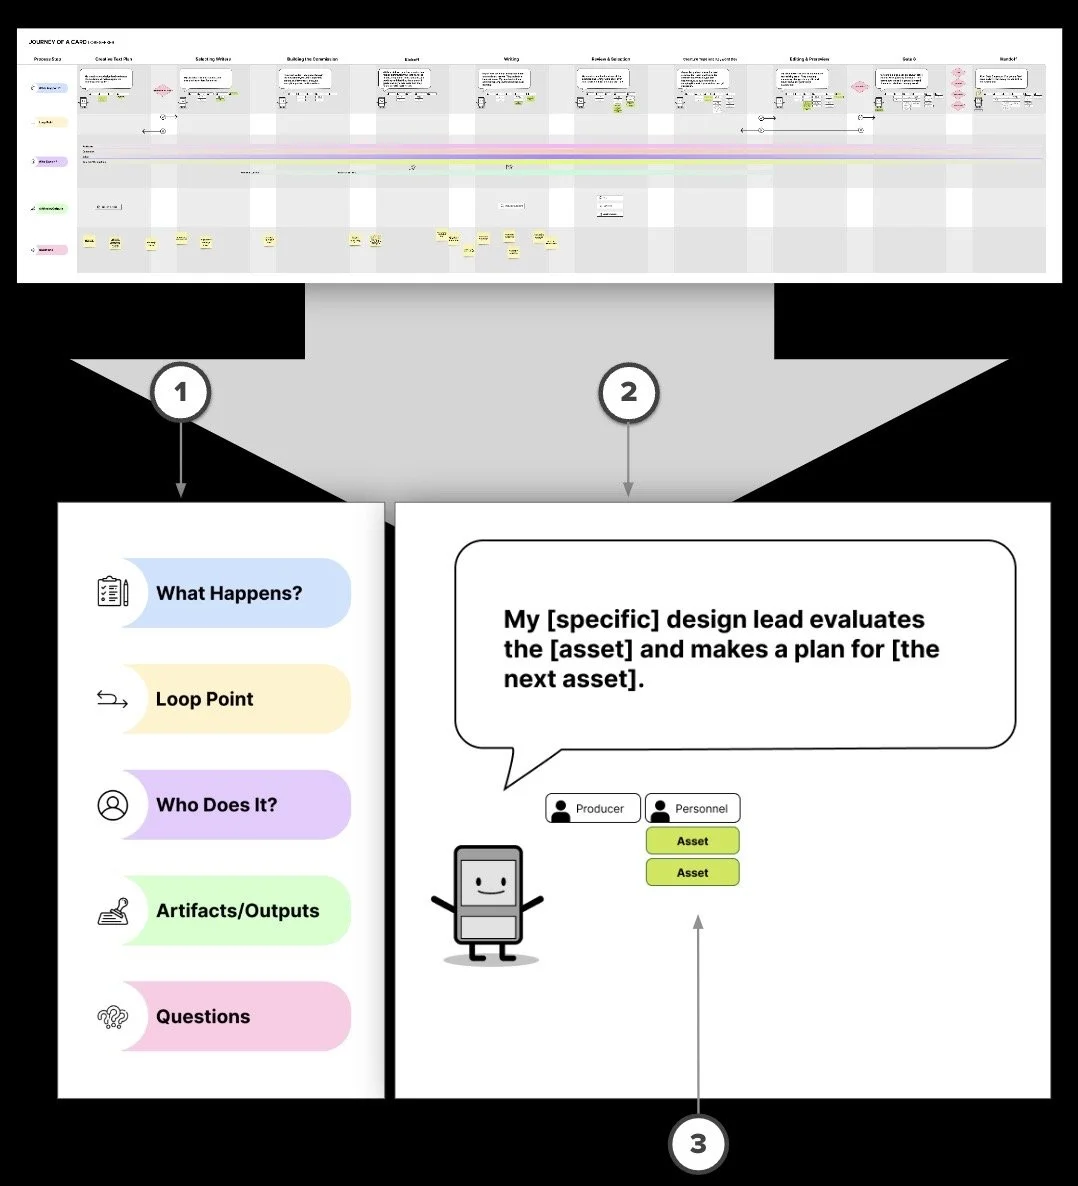
Asset Journey Maps:
I proposed asset journey maps rather than user journey maps to capture the changing asset groups and personnel in the production pipeline to better capture the full investment selections.
1️⃣ Categories include ‘Loop Points’ to show alternative workflows not captured in linear flow, and follow-up questions for the internal teams.
2️⃣ Asset provides a short summary of that section in the process, and how it relates to other roles.
3️⃣ The asset showcases roles associated with that step and newly acquired sub-assets.
I utilized these three areas to create three distinct zones, showcasing the nuances of the asset pipeline.
Using the research and client investment section, I focused on employee roles involved in the creation and use of product assets:
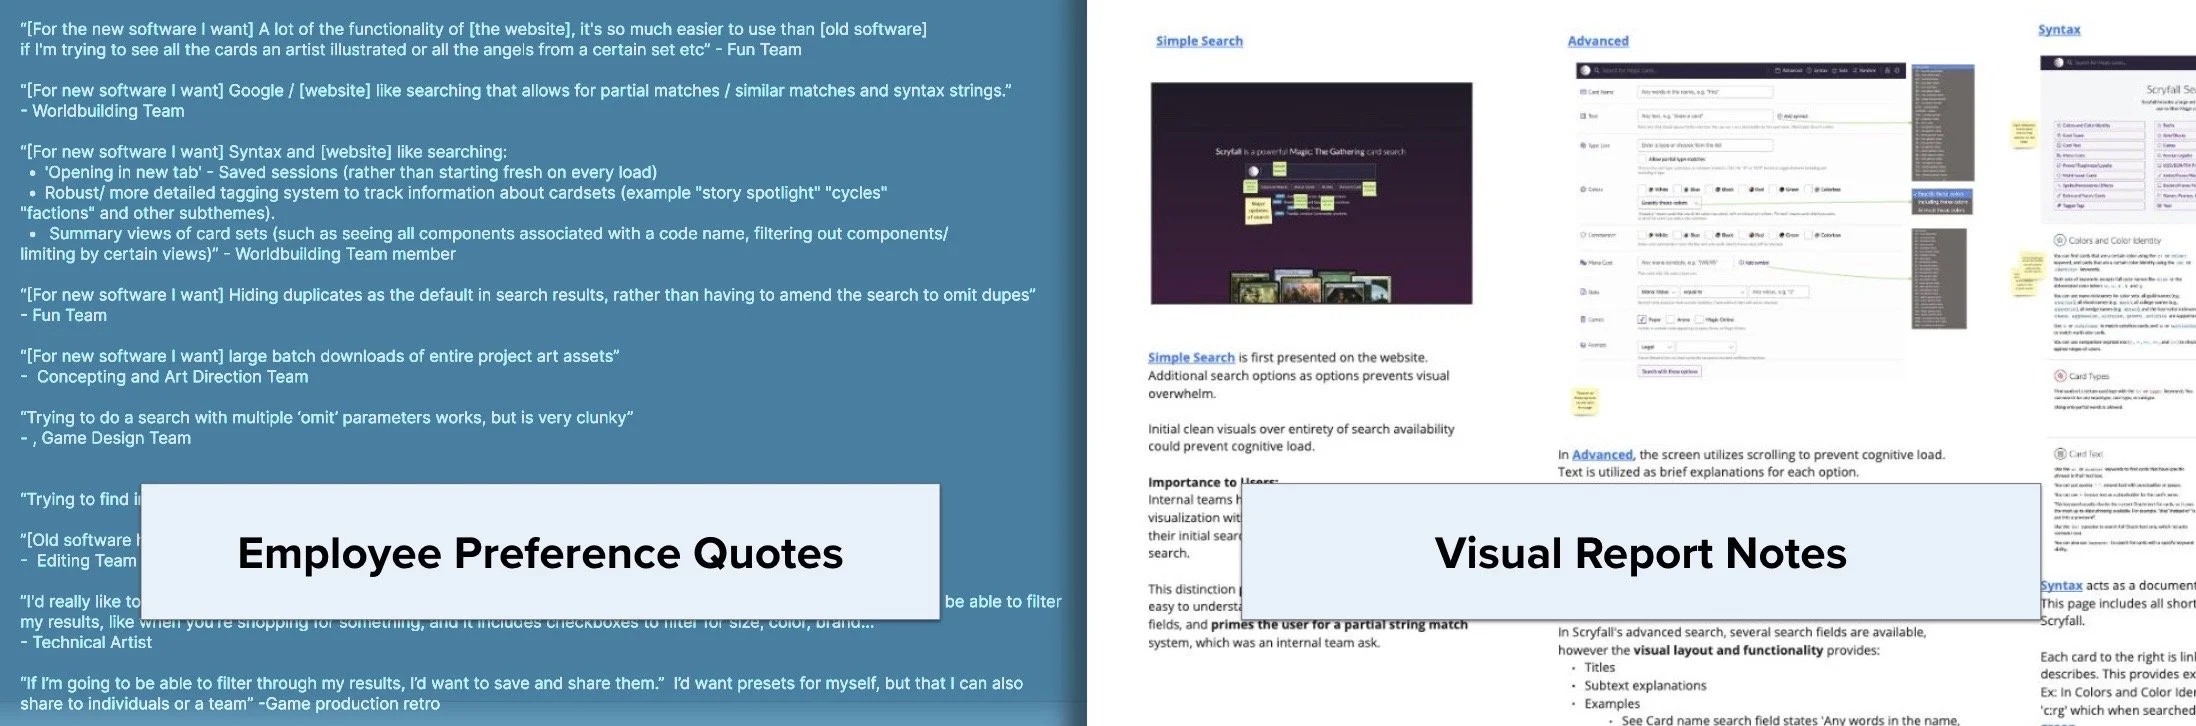
Product Brief:
The investment selection chosen required improvement of both searching and filtering existing and non-finalized libraries of their assets.
Some of the frustration and wish-related comments from employees provided baselines regarding searching and filtering in the next software upgrade. I compiled their quotes in the database. From there, I created a product brief and a back-linked visual report.
Conclusion:
The compilation of a holistic database, visual map, asset journey maps, and product brief provided an informed view of all major problem spaces, providing the client with evidence and confidence to defend their second phase of development.
Reflections:
This project required tight cross-collaborative work to keep deliverables on track during a major client’s holiday calendar, especially during the early discovery phases. I am proud of what our team accomplished. I learned a lot about internal vs. external communication, customizing research for quick action, and being more comfortable with large datasets, If allowed a similar project, I would cross-verify information early on to generate client discussions in the initial engagements. This way, we can tackle any blind spots together and forge a strong client relationship.
15
Teams were heard and documented
“I’d really like to be able to search for the attributes of any field, and combine that with as many fields as I like. I want to be able to filter my results. ”
3
Qual and Quant maps using local time cost and localized pain measurement
1
Curated custom database with structured cross-linking between Qual and Quant maps